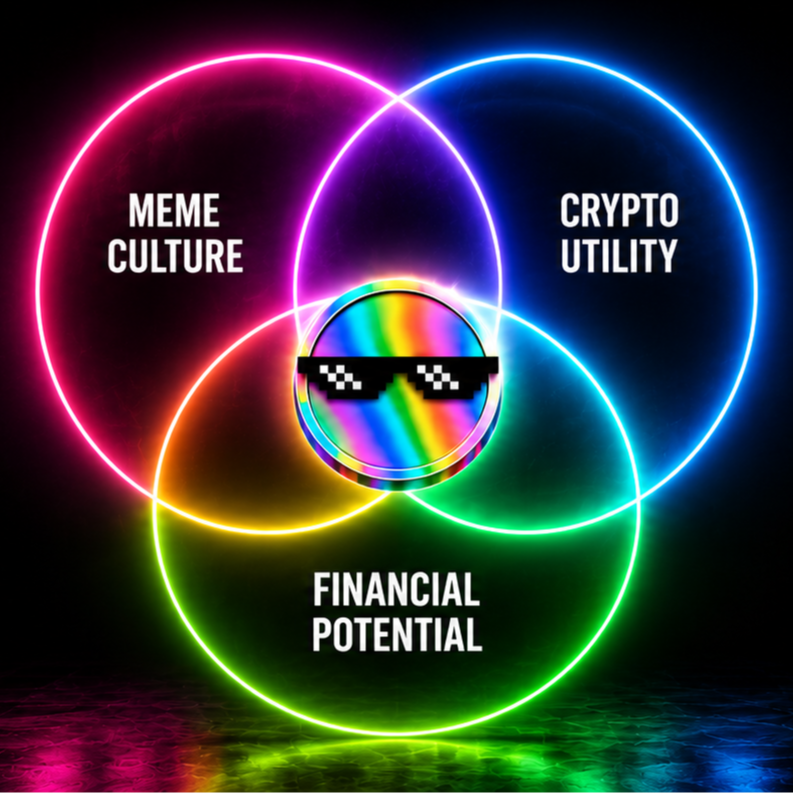
Venn Diagram Coin $VDC
49
PumpScore 49/100 Grade D
With a PumpScore of 49/100 (Grade D), Venn Diagram Coin sits in the weak band. The VDC token went live on Pump.fun 2 months ago, trades at $0.00000217, and carries $2.2K of on-chain liquidity against a $2K market cap.
What makes up the score
The biggest contributor to its score is volume vs liquidity (100/100), while 24h trading volume (0/100) is the weakest link holding it back.
Liquidity depth31
Liquidity vs market cap100
24h trading volume0
Healthy turnover0
Buy / sell balance0
Trade participation11
Survival time100
Market-cap tier20
Price stability100
Volume vs liquidity100
Price
$0.00000217
Market Cap
$2K
24h Volume
$8
Liquidity
$2.2K
24h Change
-
24h Buys / Sells
0.0000 / 1
Tip Getting noticed on Pump.fun is hard early on - a Pump.fun volume generator is a common way to boost volume and trending.
Contract
HWykVzwLG5BRBh2R4XH4dJruqoS3koFG5N5tbiTFpump
Common questions about Venn Diagram Coin
Does VDC have organic trading?
VDC traded $8 in 24h against $2.2K of liquidity, with sell-leaning order flow. PumpScore checks volume-versus-liquidity and buy/sell balance to flag wash-like patterns; this token reads as light activity.
How old is Venn Diagram Coin?
VDC is roughly 2 months old. Very young tokens score cautiously until they prove they can hold liquidity and trading over time.
How much liquidity does Venn Diagram Coin have?
VDC shows $2.2K in its pool (thin depth). Deeper liquidity relative to the $2K market cap generally means steadier prices and lower rug risk.
How do I trade Venn Diagram Coin?
VDC trades on Solana via Pump.fun and graduated AMMs. Its contract is on this page - copy it from Solscan and confirm it matches before trading Venn Diagram Coin.
Is Venn Diagram Coin safe?
No score can prove VDC is safe. Venn Diagram Coin carries thin liquidity and a 49/100 structure read, but brand-new tokens can fail regardless. Treat this as data, not advice.