Kevin Chart $KevinChart
39
PumpScore 39/100 Grade D
PumpScore rates Kevin Chart (KevinChart) at 39/100 today. The Grade D comes from thin liquidity ($-), heavy volume ($86.1K) and sell-leaning flow, measured live on Solana as of Sep 15, 2026 12:00.
What makes up the score
On the strength side, price stability leads at 100/100. On the risk side, liquidity depth lags at 0/100.
Liquidity depth0
Liquidity vs market cap0
24h trading volume95
Healthy turnover55
Buy / sell balance69
Trade participation100
Survival time4
Market-cap tier27
Price stability100
Volume vs liquidity0
Price
$0.00000305
Market Cap
$3K
24h Volume
$86.1K
Liquidity
$-
24h Change
+7.25%
24h Buys / Sells
445 / 642
Tip Struggling to get volume on this token? A Solana token volume bot can push real trading activity and help it trend on Pump.fun.
About Kevin Chart
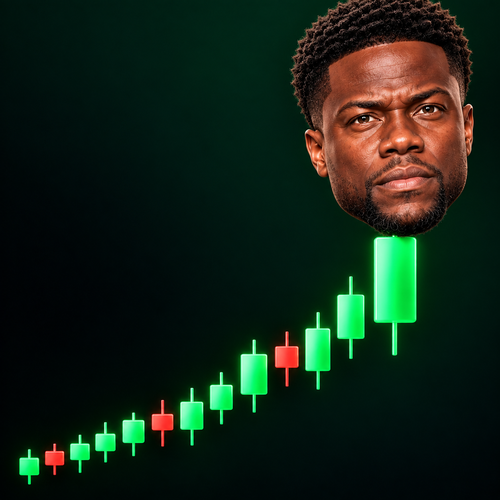
Kevin Hart, but as a bullish chart.
Contract
4cR4HZ6NzJNCAY2gi8gdaDEGJApeutC9F3bFYtJrpump
Common questions about Kevin Chart
What drives the KevinChart PumpScore?
Kevin Chart 39/100 is led by price stability (100/100) and held back by liquidity depth (0/100). The full breakdown of every signal is shown above.
Is Kevin Chart volume real?
Volume looks heavy at $86.1K. Because outsized volume on thin liquidity can signal wash trading, that ratio feeds directly into the 39/100 score for Kevin Chart.
When did KevinChart launch?
Kevin Chart launched on Pump.fun about 1 hour ago. Survival time is part of the score - the longer a token trades without collapsing, the more its structure is trusted.
Should I buy Kevin Chart?
This page is data, not a recommendation. The KevinChart 39/100 reflects current structure, which can change fast. Do your own research before trading Kevin Chart.
Can I trust Kevin Chart?
No score can prove KevinChart is safe. Kevin Chart carries thin liquidity and a 39/100 structure read, but brand-new tokens can fail regardless. Treat this as data, not advice.